
Your whole business on one screen.
Revenue, pipeline, jobs and cash in dashboards that read from the records your team already keeps — plus a report builder for the numbers you track.
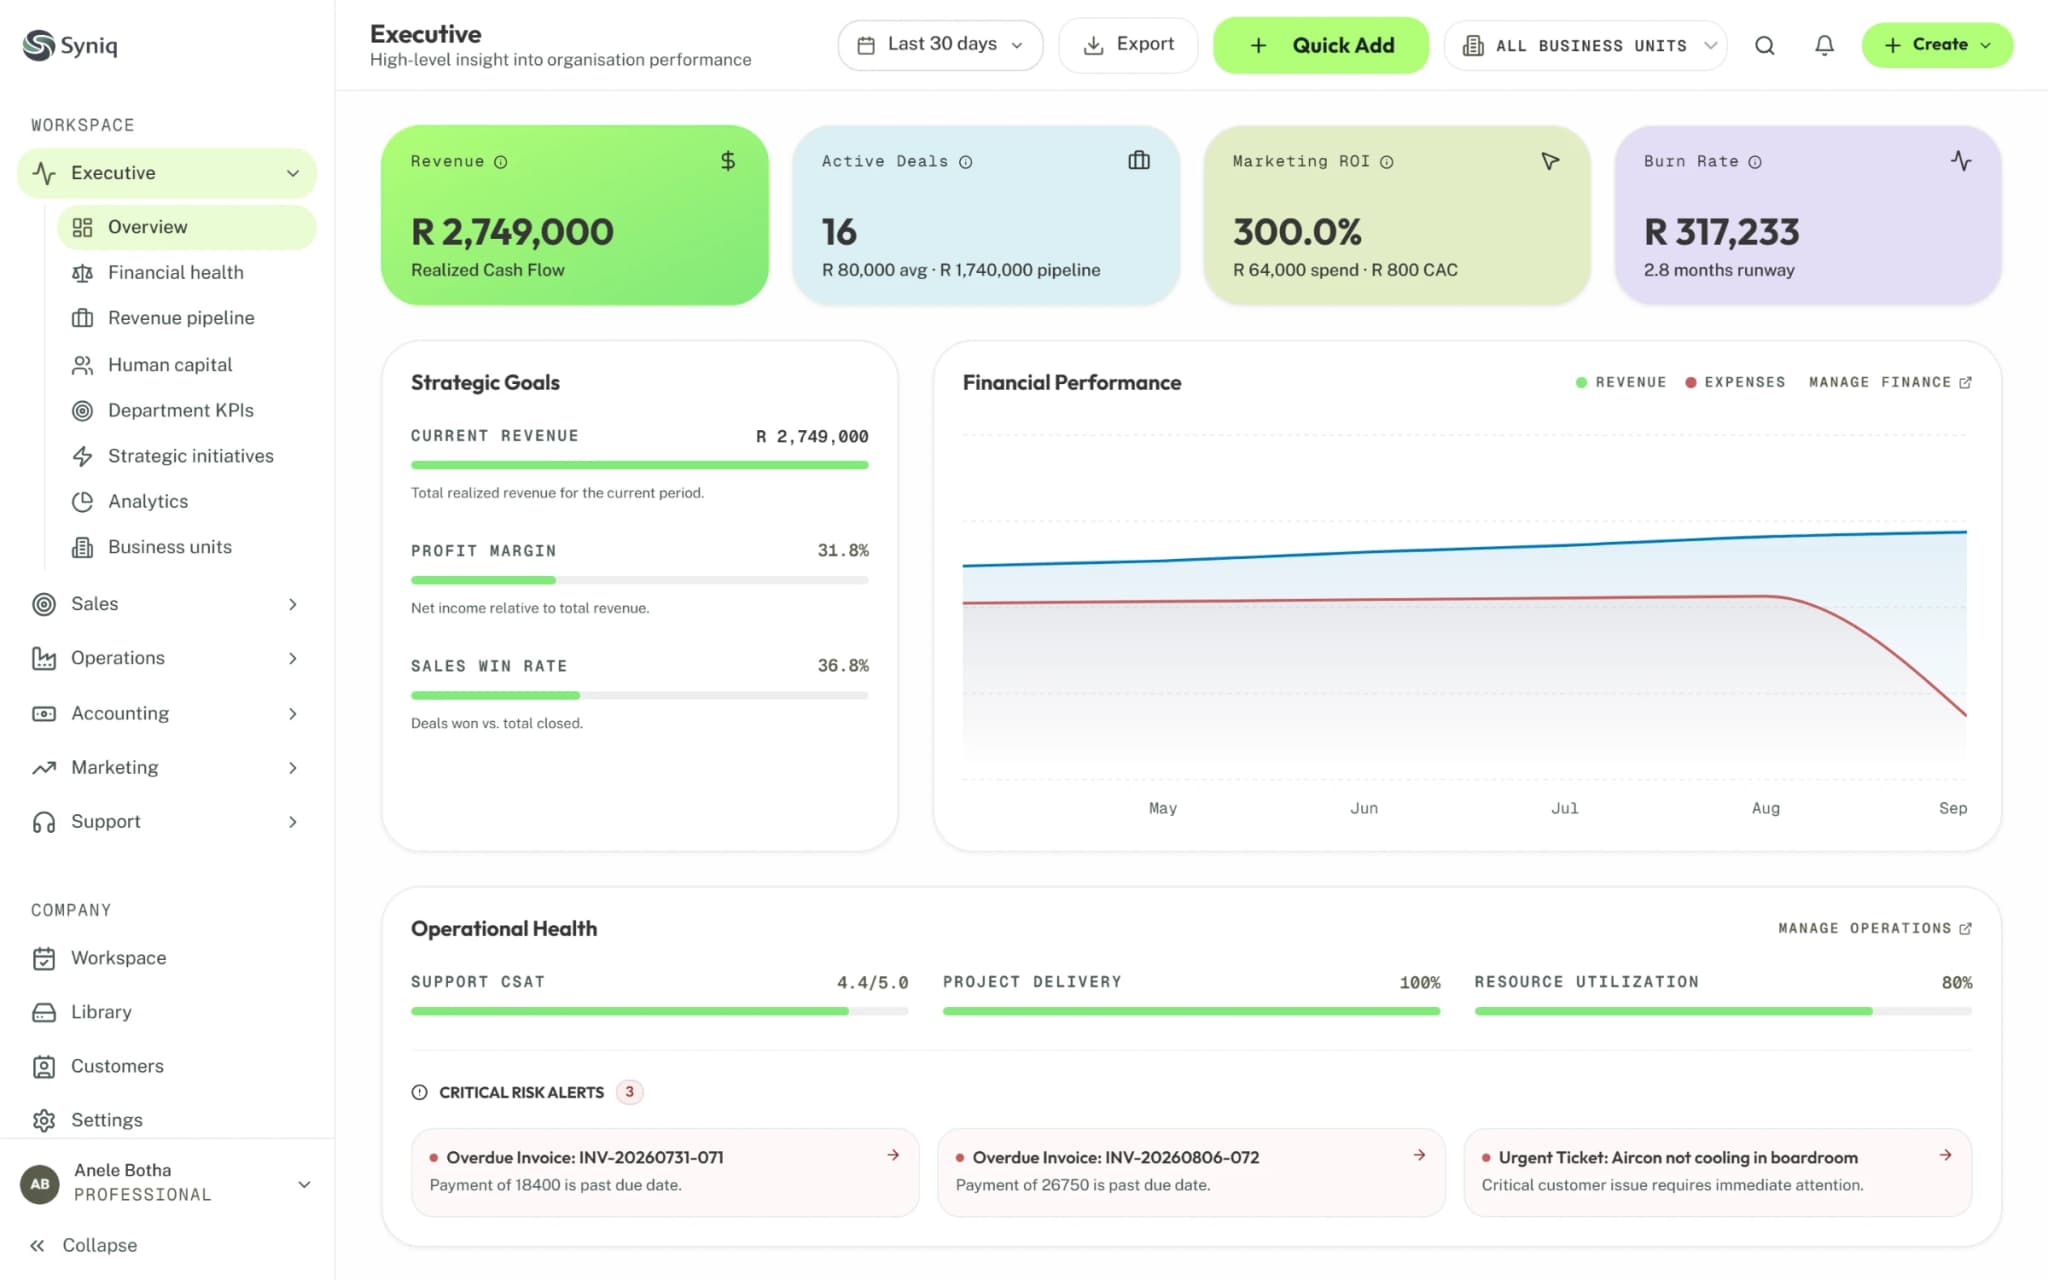
- Overview, finance, pipeline, projects, people
- 5 dashboards
- KPI, chart, table and text blocks
- Report builder
- Branded exports
- PDF and Excel
Inside Executive
One dashboard
Revenue, deals, marketing return, burn rate and customer satisfaction on one screen, read from your team's records.
Department views
Open finance, pipeline, projects and people, each with a dashboard of its own.
Business units compared
Compare revenue and win rate across business units, or open one unit's own view.
Risk alerts
Overdue invoices and urgent tickets surface as alerts on the dashboard.
Report builder
Add KPI, chart, table and text blocks to a page, or start from preset insights.
Branded exports
Export the dashboard as a PDF with your logo, or as an Excel workbook.
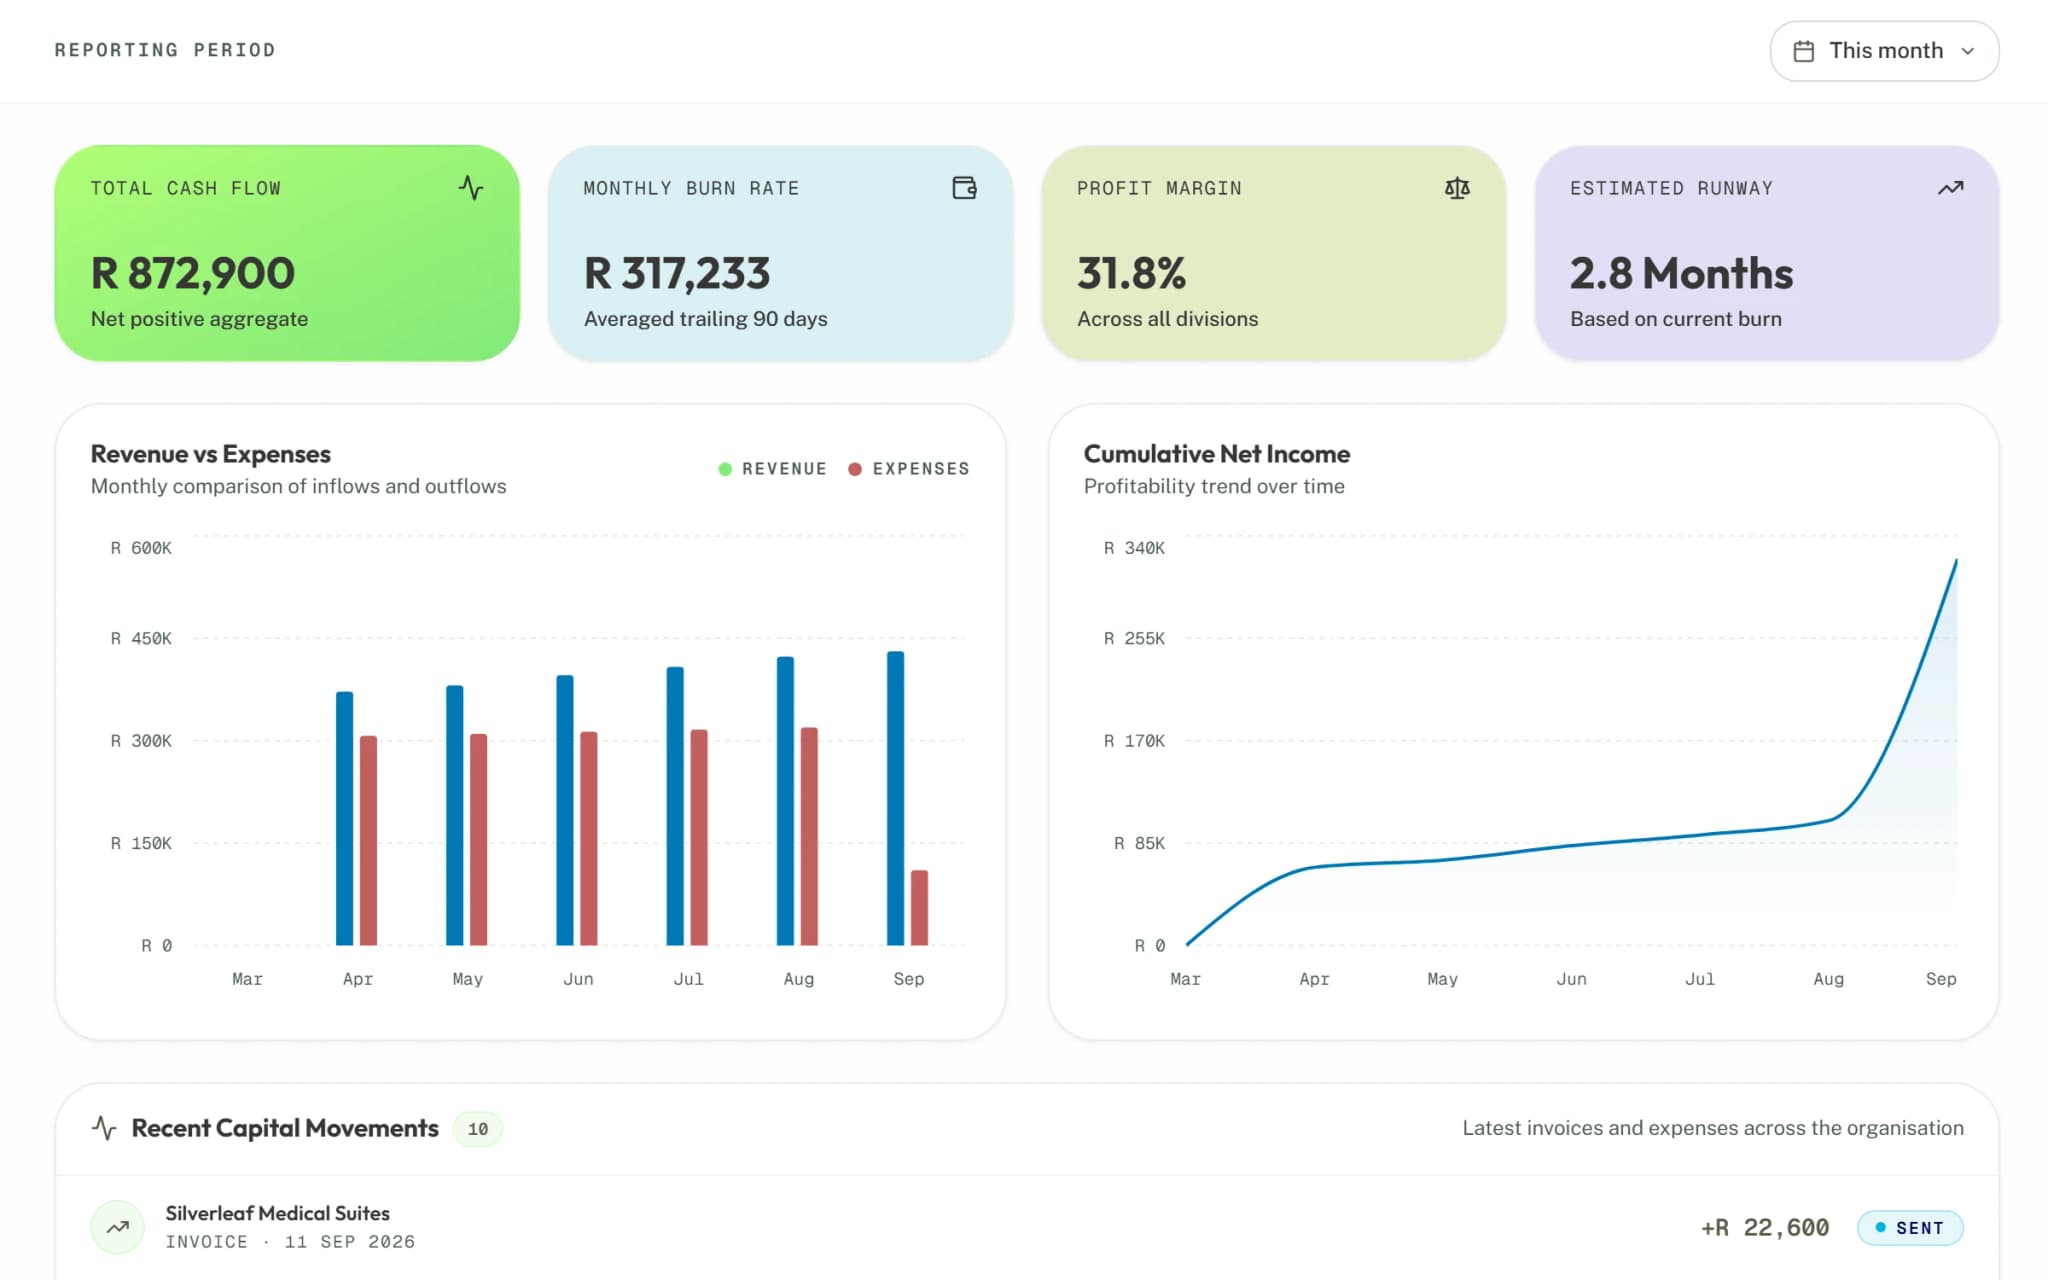
See where the money went, month by month.
Cash flow, burn rate and runway, read from the invoices and expenses your team records.
- Revenue against expenses for every month
- Burn rate, profit margin and runway at the top
- The latest invoices and expenses as they're recorded
Works with
Accounting
Invoices, VAT, purchase orders and reports.
Sales
Pipeline, client profiles and quotes.
Operations
Jobs, tasks and boards for the whole team.
Executive questions
From the records your team keeps in Sales, Operations, Marketing, Support and Accounting. There is nothing to import or export.
Yes. Compare revenue and win rate by business unit on the dashboard, or open one unit's own view.
No. Starter includes any two apps, and you can add the rest later.
Yes. Start a 14-day free trial, with no credit card.
See the whole business at a glance.
Try it free for 14 days, with no credit card.
No credit card required