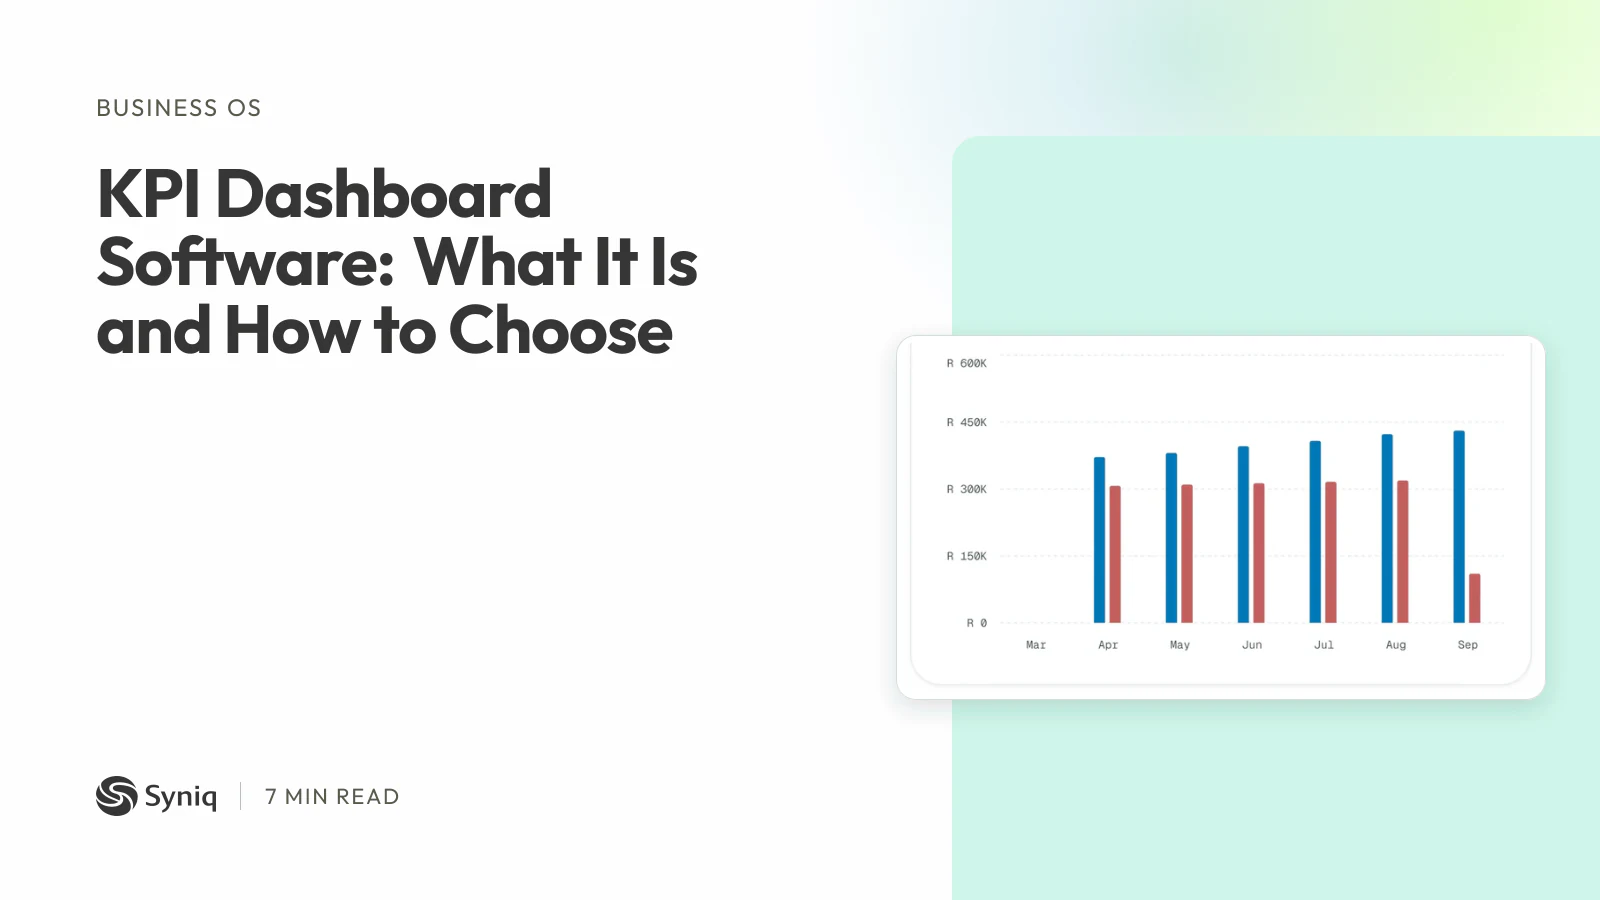
KPI dashboard software reads your business data, works out your key performance indicators and keeps them on one screen, so you can see what is on track and what is not. The software matters less than the choice of numbers: a dashboard of twenty figures nobody acts on is a slower spreadsheet. This guide sorts the tools into three kinds, gives example KPIs for a small business and says where Syniq's Executive dashboard fits.
Syniq wrote this guide and sells Syniq Business OS, which includes the Executive app. We name no other vendor's prices or features here; check each vendor's own page before you buy.
What a KPI dashboard is
A KPI (key performance indicator) is one number that shows how well the business does something that matters. A KPI dashboard puts the few that matter most on one screen, usually against a target, so a late number stands out. It answers one question: what needs a decision this week?
"Metrics dashboard software" means the same thing from the reader's side. You want a short list of numbers, kept up to date without anyone retyping them.
Three kinds of tool
| Kind | How it works | It suits you when |
|---|---|---|
| Analysis and BI tools | You connect data, build charts and write the calculations yourself | Someone on the team likes data work and the questions keep changing |
| Dashboards that collect from other tools | You connect your separate tools and the dashboard pulls their figures onto one screen | Your numbers sit in many different tools and you need them together |
| A dashboard inside the system that holds the records | The dashboard reads the same sales, job and invoice records your team already keeps | Your team already works in one system and you want no connecting work |
A spreadsheet is a fourth option and a fair first step. It goes stale the day the person who updates it is busy, which is why replacing spreadsheets with software comes up once the business grows.
Example KPIs for a small business
For an owner who wants one page, six to ten of these are enough:
- Revenue against target for the month or quarter.
- Net profit. What is left after the costs you have recorded.
- Overdue invoices. How many, and for how much.
- Open pipeline and win rate. The deals still open, and the share of decided deals you win.
- On-time delivery. Jobs finished by their target date.
- Customer satisfaction. The average score from your support tickets.
Each one should change what you do. If a number moved by a fifth and you would do nothing differently, take it off. Executive Dashboard KPIs Every South African Business Owner Should Track lists the formulas and benchmarks, and marketing analytics software covers the marketing side.
What Syniq Executive does
Syniq Executive reads the records your team keeps in Sales, Operations, Marketing, Support and Accounting, so there is nothing to import. It has five dashboards: overview, finance, pipeline, projects and people. The KPI page sets measures such as revenue, net profit, win rate, on-time delivery and customer satisfaction against targets. An owner or admin sets the targets; until they do, the page shows example targets. Overdue invoices and urgent tickets appear as alerts. You can compare business units, build a report from KPI, chart, table and text blocks, and export the dashboard as a PDF with your logo or as an Excel workbook.
What Syniq Executive does not do
- It shows records kept in Syniq. It does not pull figures from tools outside Syniq, and it does not read website or ad platform data.
- It does not send the dashboard to your inbox or chat on a schedule. You open it, or export it.
- A number is only as good as the records behind it. A deal nobody recorded is not on the dashboard.
If your numbers live in many tools that Syniq does not replace, a dashboard that collects from other tools may fit you better.
How to choose
- Write down the three decisions you make every week, such as whom to chase for payment.
- Pick the KPIs that inform those decisions and drop the rest.
- Find where each number lives today. If most of them sit in one system, start with that system's own dashboard.
- Try the tool with last month's real figures. If you have to retype them, it will not last.
- Check the price in rands and the cost over a full year.
Syniq's Starter plan is R 47 a month billed annually for one user and any two apps. Syniq is not VAT-registered, so no VAT is added. Try it free for 14 days, or see every plan.
Frequently asked questions
What is a KPI dashboard?
One screen that shows the handful of numbers that tell you whether the business is on track, such as revenue, cash, open deals and overdue invoices, usually set against a target. Its job is to show which number needs a decision this week.
What is KPI dashboard software?
Software that reads your business data, calculates your KPIs and keeps them on a dashboard, so nobody rebuilds a spreadsheet each month. Some tools pull from many other tools; some read the records of the system they belong to.
What are good KPI dashboard examples for a small business?
A one-page owner view: revenue against target, cash in and out, overdue invoices, open pipeline and win rate, jobs delivered on time and customer satisfaction. Six to ten numbers, each tied to an action, is enough.
Do I need a separate KPI dashboard tool?
Only if your numbers live in several tools that nothing else connects. If sales, jobs and invoices already sit in one system, a dashboard built into it saves the connecting work.
Does Syniq have a KPI dashboard?
Yes. Syniq Executive has a KPI page that sets measures such as revenue, net profit and win rate against targets, plus dashboards for finance, pipeline, projects and people. It shows records kept in Syniq only.